The Inverted Yield Curve and How Well It Predicts a Recession
- August 21, 2019
- by Michael
If you follow business and stock market publications, you’ve probably picked up the talk about yield curve inversions recently. This makes some people jumpy, expecting a recession is coming. Others say that worry is misguided.
What is a yield curve?
A yield curve refers to a graph of the relative returns of different durations of treasury bonds.
In a ‘normal’ yield curve, longer-term debt has higher returns so it slopes up. Yield curves are considered ‘inverted’ when short-term bonds have a higher yield, or return, than long-term bonds and the line slopes down.
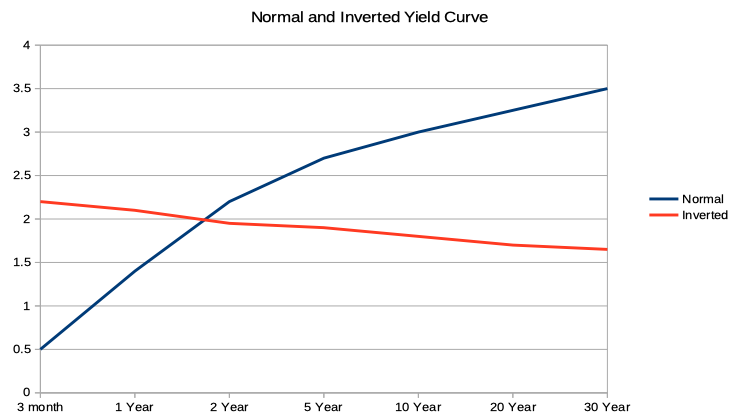
When the yield curve is inverted shorter term bonds pay a higher rate than longer term bonds, which is counterintuitive. Normally when committing to a longer term you would expect to get a higher rate of return.
During periods of healthy economic growth, the yield on a 30-year Treasury bond will be about three points higher than the yield on a three-month bill. The yield curve inverts when investors expect a coming recession and create more demand for longer-term bonds, driving the yields needed to attract investors to those bonds down. At the same time, demand for short-term bonds falls, driving the interest rates for those bonds up.
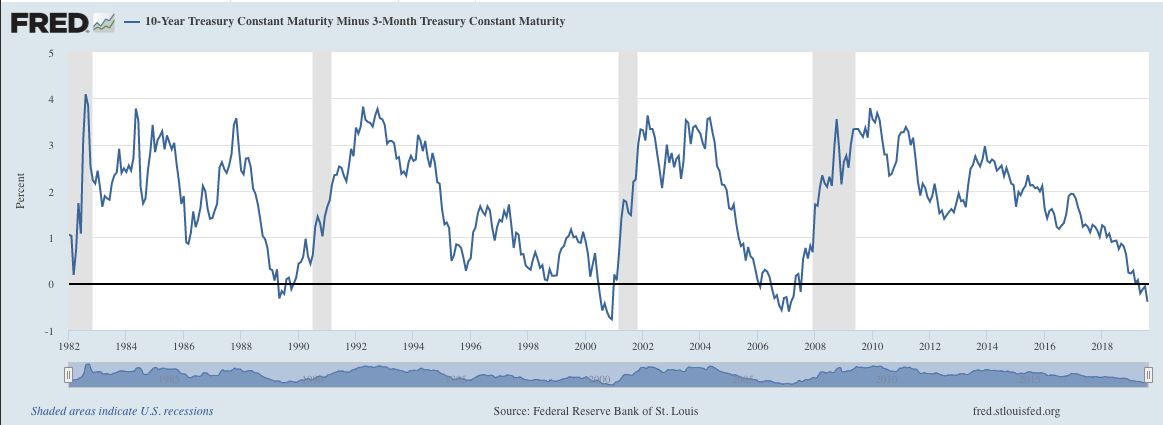
Typically the difference between the 10 year T-bill and the 3 month T-bill is used. Although this could only be a ‘partial’ inversion, if the 20 year T-bill minus the 3 month T-bill was still positive.
The Federal Reserve graphs it like so:
Why does a yield curve inversion make people nervous?
Since the 1960s, the yield curve has inverted ten times. Six of those times a recession has followed the inversion within 18 months. Two of those times the yield curve de-inverted without a recession. The last time the yield curve inverted was in May of 2019 and the outcome is still to be determined.
Economists consider inverted yield curves to be a reasonably most reliable indicator that a recession is coming, but if and when a recession hits is an open question. As the table below shows the market can continue to rise for many months after a yield curve inversion.
|
Date of Inversion |
Associated Recession |
Months Until S&P 500 Top* |
Months Until Recession Start |
|
Sep 1966 |
n/a |
n/a |
n/a |
|
Dec 1968 |
Jan 1970 |
-1 |
13 |
|
June 1973 |
Dec 1973 |
-5 |
6 |
|
Nov 1978 |
Feb 1980 |
15 |
15 |
|
Oct 1980 |
Aug 1981 |
1 |
10 |
|
Jun 1989 |
Aug 1990 |
10 |
14 |
|
Jun 1998 |
n/a |
n/a |
n/a |
|
July 2000 |
Apr 2001 |
1 |
9 |
|
Aug 2006 |
Jan 2008 |
14 |
17 |
|
Mar 2019 |
? |
? |
? |
|
Average |
5 |
12 |
* The nearest S&P 500 top prior to the recession in months away from the date of the inversion. If negative, the market was already dropping. If positive, the market was still going up prior to the recession hitting.
Are we headed for a recession?
In my opinion, anyone who claims to know for sure that we are or are not headed for a recession is deluding him or herself, or purposefully deluding others. Here’s why:
- Economic predictions are not an exact science, especially when it comes to timing the stock market. Economies are complicated, and there’s usually not one single factor that leads to a recession or a boom. That’s why even experts have a terrible track record of predicting stock market performance.
- It’s easy to find opinion pieces arguing that, while inverted yield curves have almost always led to recessions in the past, this time is different. I tend to take these opinions with a grain of salt. First of all, they are often written by investment advisors who have an interest in encouraging people to continue investing. Second, the ‘this time is different’ argument strikes me as naive. Every recession is different. An inverted yield curve preceded recessions in both 1981 and 2008, though other economic indicators and general economic conditions changed between the two recessions.
- The Cleveland Fed has estimated that there’s about a 35% chance the US economy is headed for a recession within a year (as of August 2019). That’s not a very worrying number… but the Fed was also especially wrong in the years leading up to the 2008 “great recession”.
An inverted yield curve has historically been among the most reliable predictors of an upcoming recession. While that does not mean a recession is inevitable, it certainly means there is reason for concern. Some analysts say the yield curve has to stay inverted for at least a full quarter to accurately predict a recession, and that has not happened. There is good news, though: your investment behavior shouldn’t change, regardless of whether or not a recession is on the way.
For more reading:
- JP Morgan’s Guide to the Markets 2018 Market Insights 1Q 2019 As of December 31, 2018. See page 33 for a chart of yield curve steepness and recessions.
- From the Federal Reserve Bank of St. Louise - Does the Yield Curve Really Forecast a Recession?