
Plot your course to Financial Independence by finding out exactly where you are now and what moves you could make savings, budget and retirement wise.


The Income Spending Simulator projects the course of your income, expenses, assets, and loans and graphs the resulting cash flow, debt, asset appreciation, and net worth. It allows for all kinds of adjustments and customization. It even supports a "comparison" mode where you can see the impact of a single change (or group of changes) compared to the initial conditions.
The Income Spending Simulator answers questions like:
- How much do I need to retire?
- When can I retire comfortably?
- How soon can I be financially independent?
- Can I afford to take an awesome vacation?
- Will I be able to send my kids to college?
- What if I quit my stressful job and work part time for awhile?
- How much is my car really costing me?
- Should I continue renting or buy a house?
Some things we think are really cool:
- You can start off pretty basic (one line for all income, one line for all expenses), but the calculator gets as granular as you like.
- You don’t need to register to try it out or even save records. If you do register, records you saved will be automatically associated with your account (provided your browser cookie is intact).
- The simulator exposes the cost of borrowing, both in terms of home loans and cars.
- The Income, Expense, and Asset lines can be configured with custom growth rates. For instance, it is a safe bet that your grocery bill with grow with inflation. It might also be that your wages will grow for the next few years, but then top out at a certain value. These options are accessible when you click on the line and expand it.
- The stories this tool can tell are pretty interesting to us. For example, the story of a person who worked hard and invested in themselves first, or the person who took off a year to travel the world but didn’t sacrifice their retirement nest egg in the process. Career choices can also be explored, see our article on Becoming a Plumber vs a Doctor.
Compare Mode:
Change one or more inputs and explore the result. Quickly asses the overall financial impact of trade offs like:
- What if you took that promotion or instead quit and travelled the world?
- What if you decided to sell your house and buy and duplex, renting out the other side?
- What if you bought a really awesome car?
- What if you cancelled your TV package?
Features / Behaviors:
- Specify the number of years to run the simulation for, with a default inflation rate and growth rate.
- Tracks cash savings which grows at the default rate of return.
- Computes starting net worth and ending net worth.
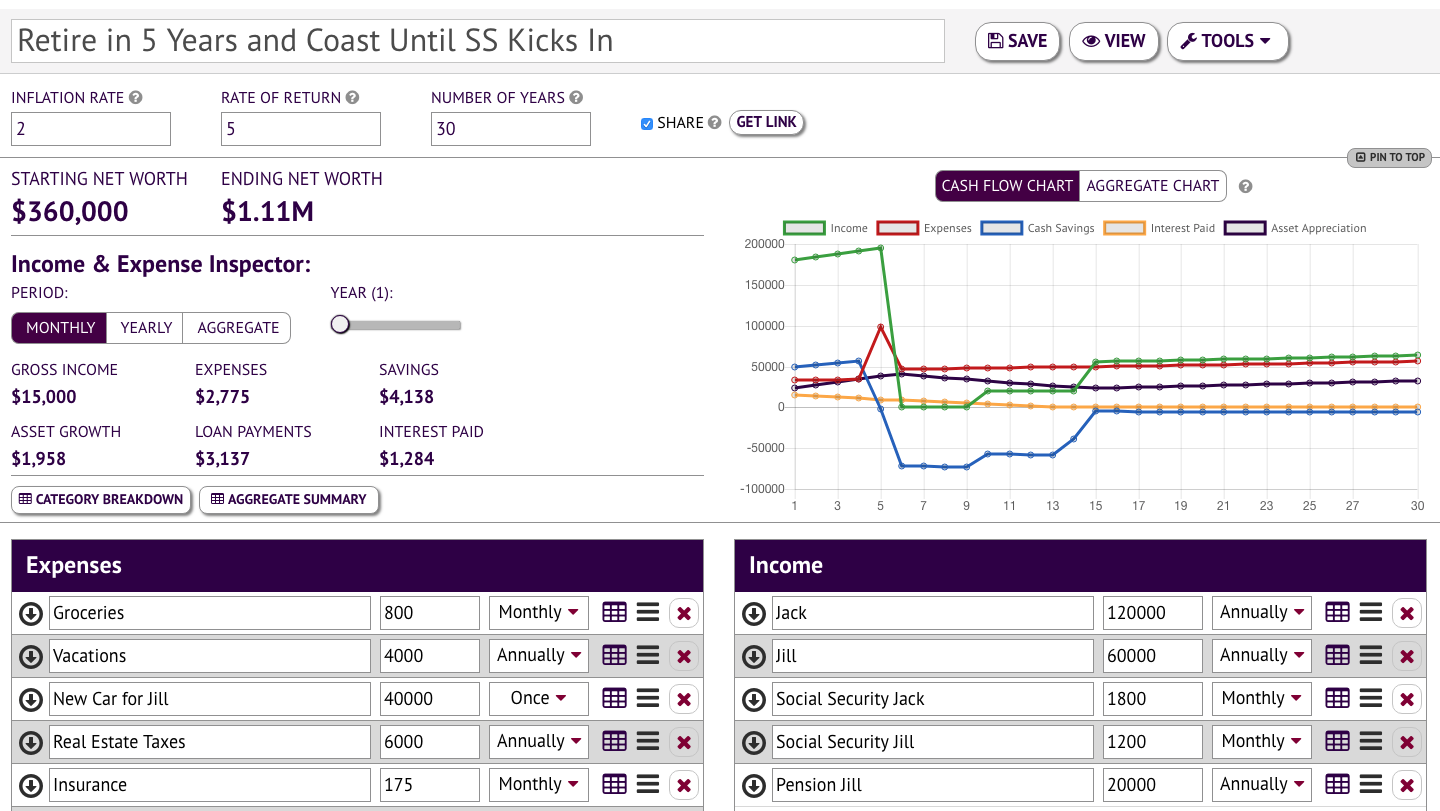
- The Income and Spending Inspector shows Gross Income, Expenses, Savings, Asset Growth, Loan Payments, and Interest Paid. Filter for a given year and display totals on a Monthly or Yearly basis. Or display totals in aggregate.
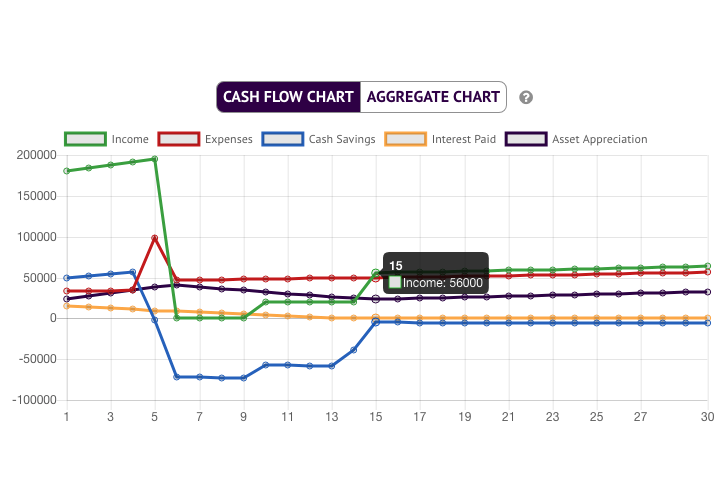
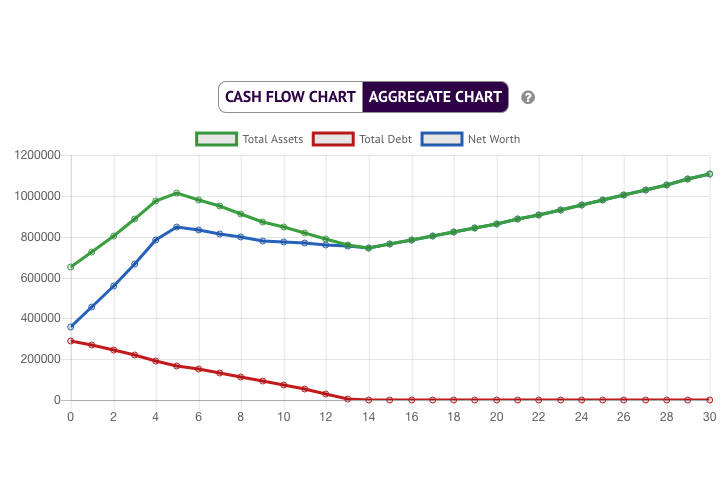
- Two graphs:
- Cash Flow Chart displays Income, Expenses, Cash Savings, Interest Paid and Asset Appreciation.
- Aggregate Chart displays Total Assets, Total Debt and Net Worth.
- The main simulation inputs are Income, Expenses, Loans, and Assets:
- Click the table icon to view a year by year breakdown for that particular line.
- Click and drag the handle icon to reposition the line.
- Click the X button to delete the line.
- A line can be set up to be effective across a given range. Say for example, in 10 years you will start drawing social security, or in years 6-8 you plan to go back to school.
- Income, Expense, and Asset lines can be configure to change their value with time. This is important for accounting for raises / promotions, inflation, asset appreciation (like a house or stock portfolio) and asset depreciation (like a car).
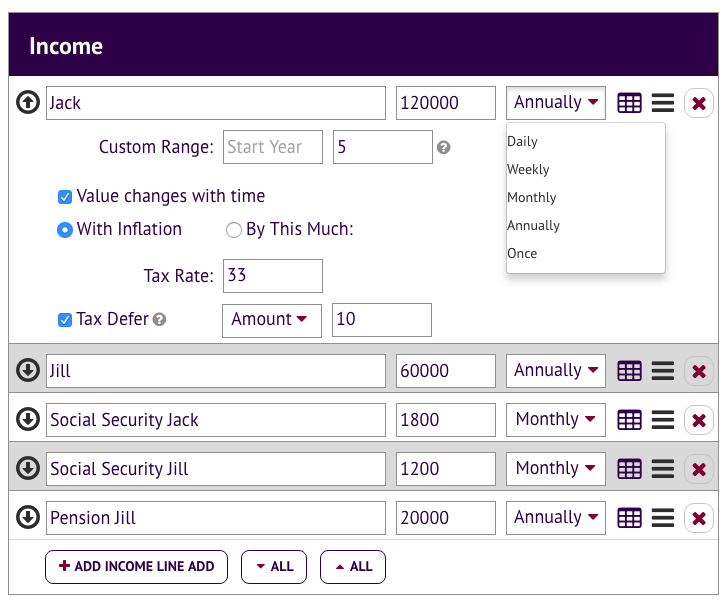
- Income lines:
- Enter name, amount, and frequency (daily, weekly, monthly, annually, or one time).
- Optional - Specify which years the line applies to.
- Optional - Value changes with time. When checked, each year of the simulation the amount will grow based on the selected option. Choices are grow with inflation, grow by a custom amount or percent. There is an optional limit on the growth (maximum value).
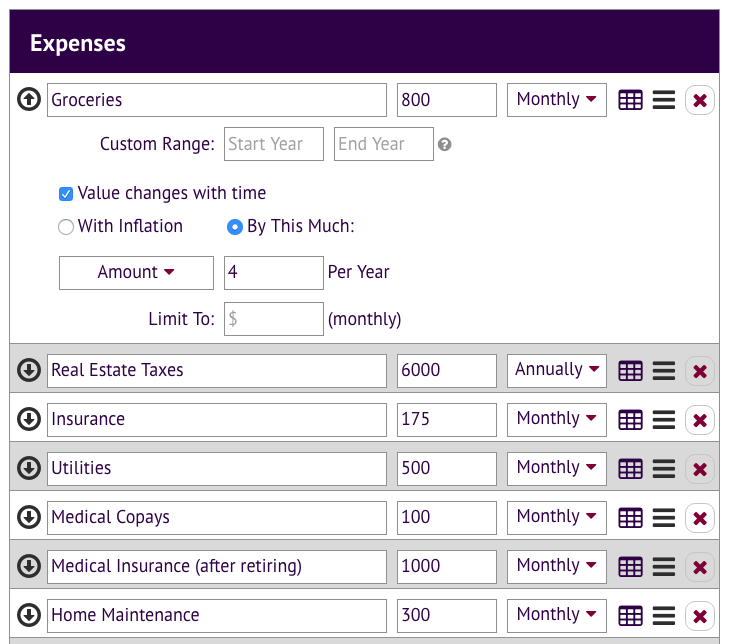
- Expense lines:
- Same fields as Income Line, except gets additional tax rate and tax defer properties. When tax rate is set, the income is reduced by that amount and the tax acts an expense in the same year. When tax defer is checked, that portion of the income is subtracted before the taxes are calculated.
- Same fields as Income Line, except gets additional tax rate and tax defer properties. When tax rate is set, the income is reduced by that amount and the tax acts an expense in the same year. When tax defer is checked, that portion of the income is subtracted before the taxes are calculated.
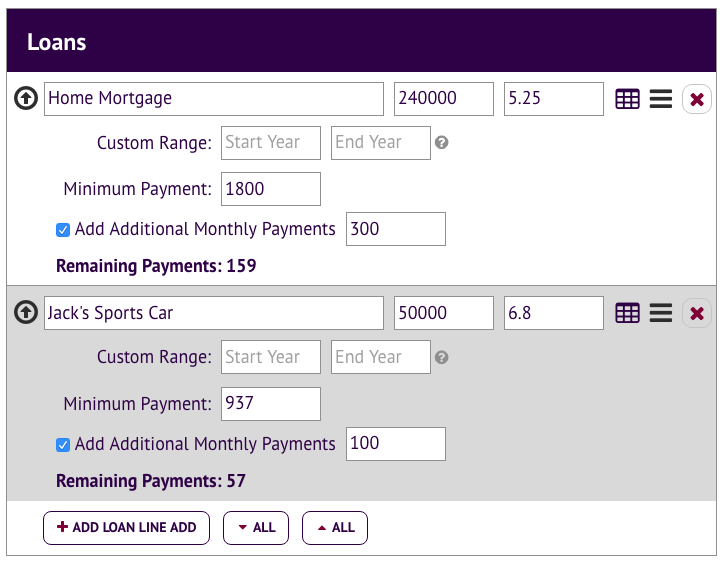
- Loan lines:
- Enter name, balance, interest rate, minimum payment.
- Optional - Specify which years the line applies to.
- Optional - Add additional monthly payments.
- Displays the number of remaining payments for the loan.
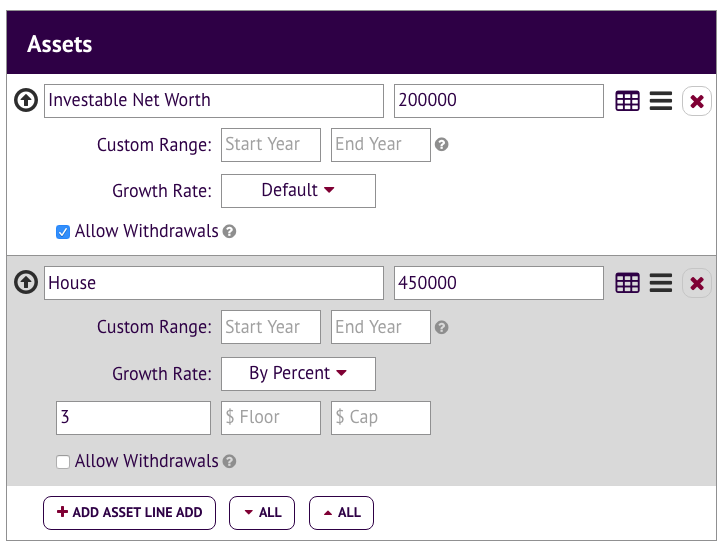
- Asset lines:
- Enter name, balance.
- Optional - Specify which years the line applies to.
- Growth Rate - by default amount, with inflation, or a custom amount or percent. When a custom amount or percent is selected, an optional floor and cap can be entered for the asset value.
- As the asset grows (or shrinks) by a given amount each year, it applies the difference to the asset appreciation column.
- Optional - Mark the asset as 'Allow Withdrawals'. When cash flow is negative and this box is checked the simulator will draw down the account to cover the shortfall (if funds are available). Multiple assets may have this option checked. The first selected asset in the list will be drained before going to the next highest one. Makes sense for liquid assets like retirement accounts.
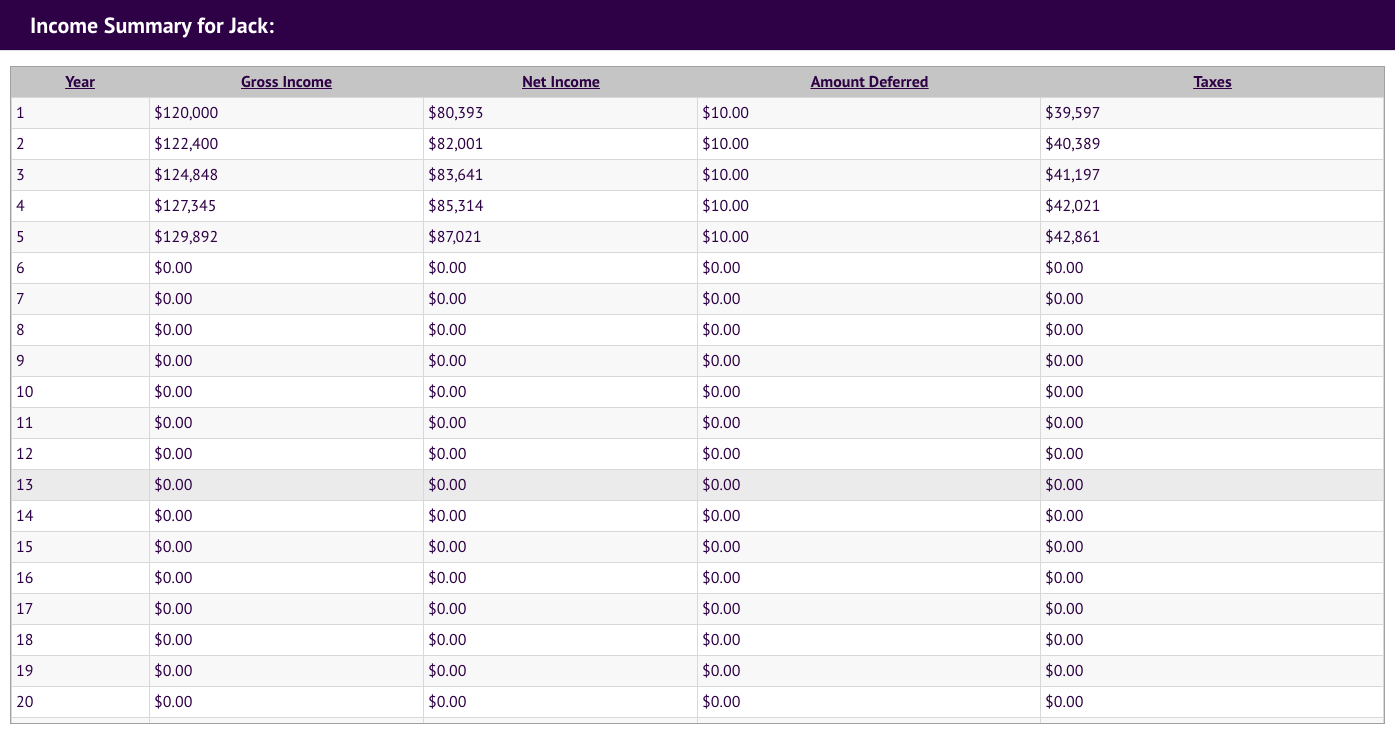
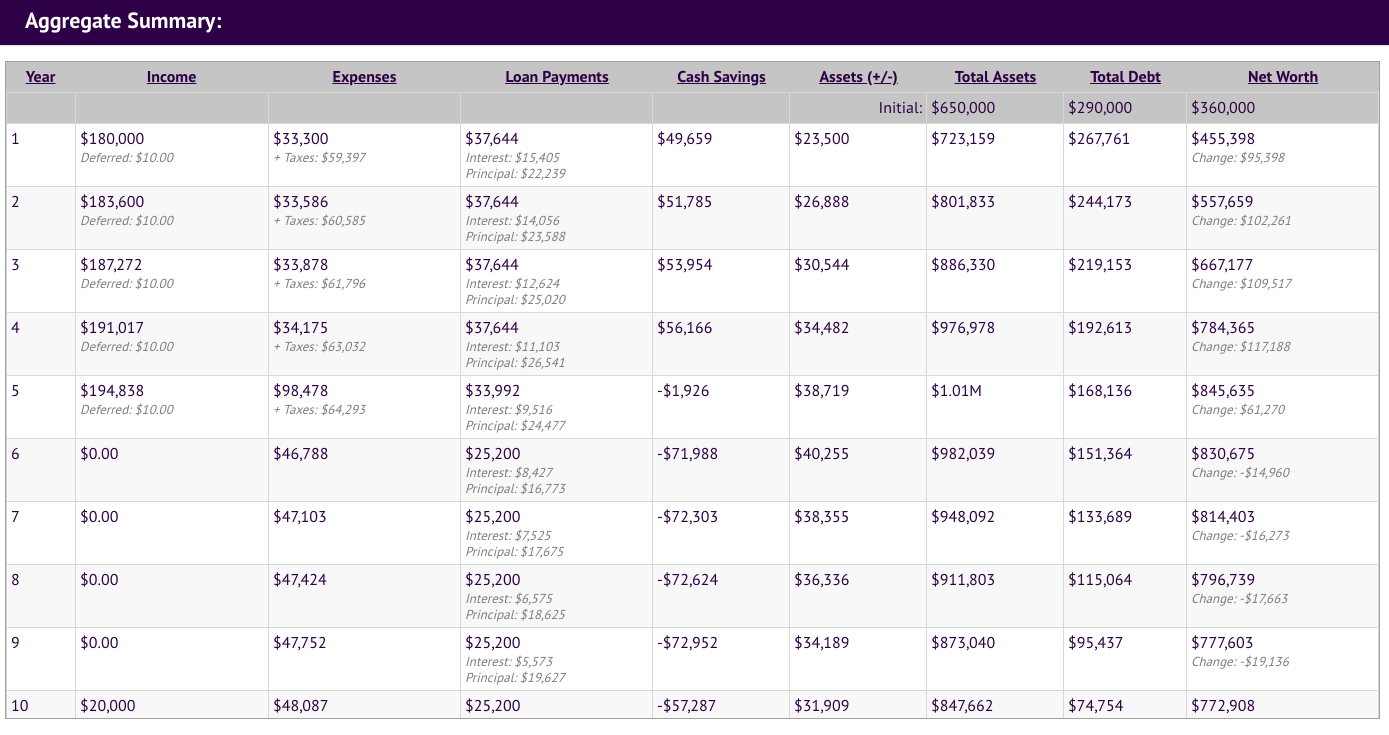
- A tabular per year summary is available which displays: Income, Taxes, Tax Deferred Income, Expenses, Loan Payments, Interest Paid, Principal Paid, Cash Savings, Asset Appreciation, Total Assets, Total Debt, Net Worth, and Change in Net Worth.
- Supports sharing by URL (simulations are not shared by default).
Release History:
- 2.0.2 July 19th, 2022
- When saving with nothing entered correct error message appears.
- Help text and minor UI fixes.
- 2.0.1 January 19th, 2022
- Dollar values are aligned better in view mode.
- Minor UI bug fixes.
- Performance updates for currency formatting, build size reduced, updated libraries.
- 1.4 April 25th, 2018
- New Category Breakdown screen that shows the total value of each line item and the percentage relative to the overall total. For example, groceries is X% of total spending and sums to $Y. Works for for income, expenses, and loans (interest paid). Interesting way to see how things stack up. Does require detailed line entry to be meaningful.
- Visual updates to increase legibility and make it easier to use.
- Minor bug fixes.
- 1.3 November 8th, 2017
- Adds confirmation to leave page if there are unsaved changes.
- iPad user interface fixes.
- 1.2 October 12th, 2017
- Improved retirement simulation logic. Assets may be flagged as 'Allow Withdrawals'.
- Table improvements added.
- Totals are displayed at the bottom where it makes sense.
- Column headings are kept at the top of the screen.
- 1.1 October 2nd, 2017
- Compare Mode released! See Tools -> Compare to experiment with changes to your simulation and see the impact.
- Minor bug fixes.
- 1.0 September 25th, 2017
- Initial release!
Help Topics:
- Start by giving your simulation a name.
- Select inflation rate, rate of return, and the number of years to run the simulation for.
- Enter line details under the Income and Expense sections. It is okay to start broadly (expenses of $3000 month). As you get more familiar with the tool you may wish to get very specific ($800 for groceries, $100 for coffee, $1200 for rent, etc).
- Enter Loans (car, school) and Assets (like a home, auto, mutual fund, savings, etc) if applicable.
- Explore the results at the top!
- There are two graphs - cash flow and net worth.
- In tabular format the Income & Expense Inspector displays stats on a monthly, yearly or aggregate basis. The slider bar filters for the year (applies to monthly and yearly mode).
- The results section can be pinned to the top to make it easier to see changes as you enter them.
- Optional - fill in the description at the bottom.
- Click Save at the top to retain your work and come back in the future.
- The lines are the main inputs for the simulation.
- When you click on a line it expands to reveal additional options (see next section).
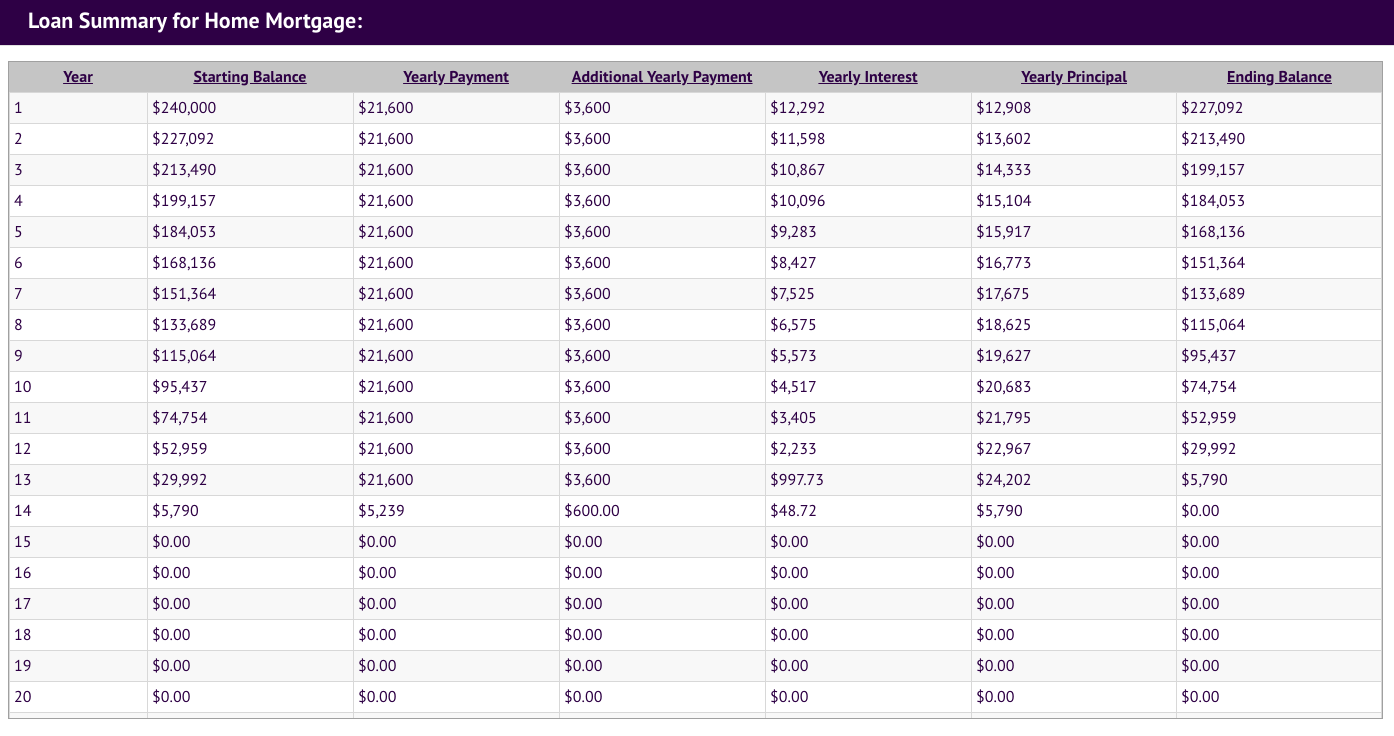
- Click the table icon to view a year by year breakdown for that particular item.
- Click and drag the handle icon to reposition the line.
- Click the X button to delete the line.
By default a line will apply to all years in the simulation. That can be changed by entering a custom range. Enter values based on the simulation year (1, 5, 10) as opposed to calendar year (2045). For example, you plan to attend a three year degree program two years from now. For the degree program line's custom range you would enter 2 as the start year and 5 as the end year. When the start box is left empty that line goes into effect in year 1. When the end box is left empty the simulation runs until the last year.
Income, Expense and Asset lines can be setup so the amount changes with time. For some items, like expenses, you may want to set it to ‘grows with inflation’. Assets by default grow at the simulation rate of return set at the top of the screen. Assets can also have their growth floored or capped. For example a car could be setup so it never drops below $500. The simulator applies the change in value value at the end of every year.
Income lines get additional fields for tax rate, and an option to defer income (which are taken as a pre-tax deduction).
As the simulation runs it keeps track of the running total of cash savings or cash shortfall. When that balance is positive it grows at the default rate of return and appears as an asset. When the balance is negative, it is reflected as total debt but it does not incur an interest charge. There is an implicit assumption that extra cash is invested and grows at the default rate of return.
Click on the table icon at the top to view a year by year summary of the entire simulation. Each line also has a table icon that shows a year by year summary of just that line’s contribution to the overall simulation.
Simulations can be saved to our database and associated with your account.
If you are not logged in, simulations are still owned by you, but only linked via a browser cookie. If you clear your cache they will be lost. After you register or login, your simulations will automatically be brought under your account.
Simulations may also be copied under Tools -> Save As...
At your choice, simulations can be shared by URL. Simulations that are shared also appear in our searchable database and in search engines. If you are going to share a simulation, but it contains personal information like your salary, debt, etc, we highly recommend you use a ‘handle’ as your username to identify yourself (like the name of your pet) instead of your own name. Same goes for your profile picture. You can update your username and profile picture under your profile.
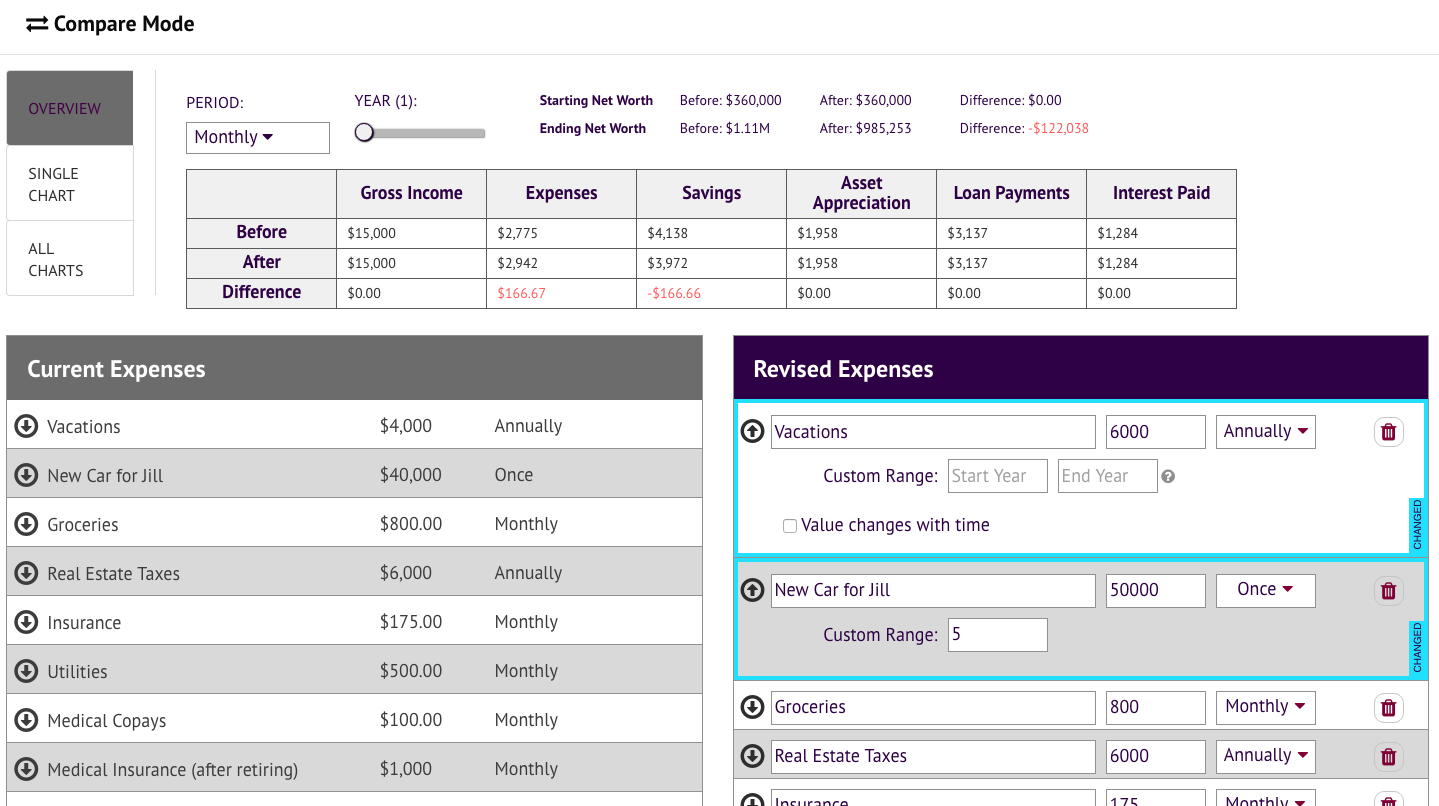
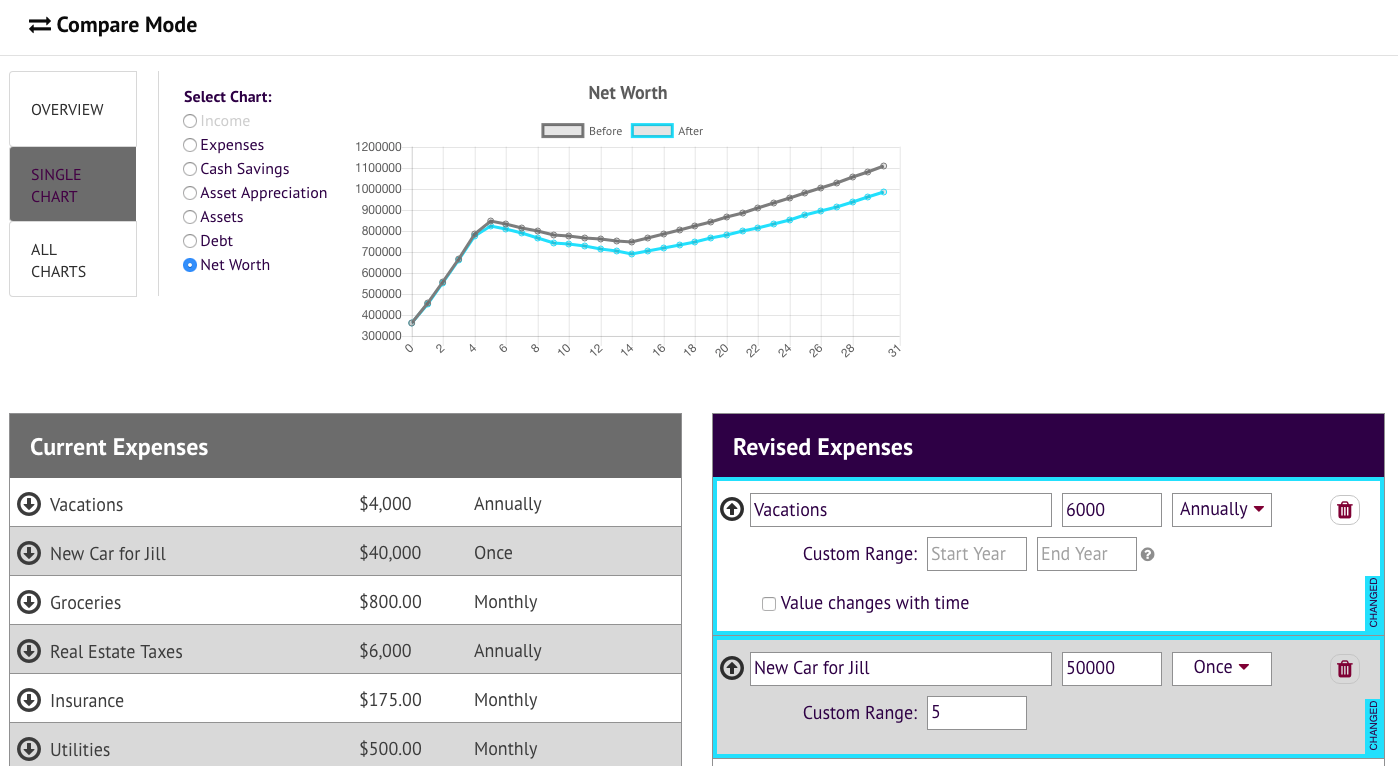
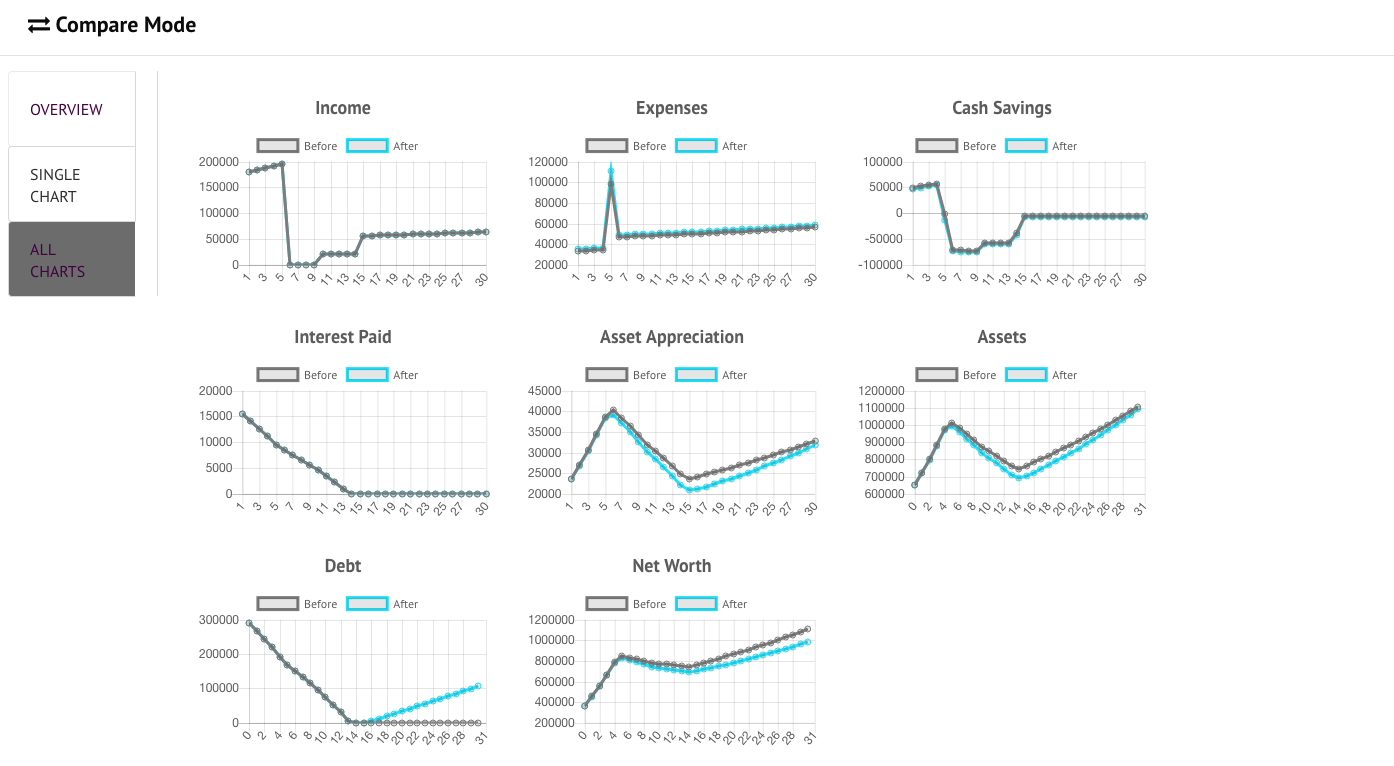
Under Tools -> Compare Mode, a before and after comparison can be made. On the left it displays what you had in the simulator before opening compare mode. On the right, you can add/edit/remove lines to create the ‘after’ picture. The changes could be small like an adjustment in spending habits, or as big as changing jobs or traveling the world for a year. The compare mode screen computes the difference of every graph and stat available in the main mode.
In the simulator a car is a combination of several things:
- A loan line (assuming you are using a loan to purchase the car).
- An asset line (presumably it drops in value by a large percent or amount each year).
- Expense lines for insurance, gas, title fees, and maintenance.
In the simulator a house is a combination of several things:
- A loan line (assuming you are borrowing). The loan component should only be the principal plus interest, the escrow portion (taxes and insurance) should be entered as expenses.
- An asset line (presumably a home grows modestly in value each year).
- Expense lines for taxes, insurance and maintenance.
- Possibly an income line if you plan to rent out part or all of the home. Though that may involve more expenses such as lawn care, management fees, cleaning fees, utilities, etc.
In the future we plan to create new line types for cars and houses.
Keep in mind this is just a financial simulator! Unexpected events (good or bad) can have a major impact on how financial life plays out. The numbers you end up with could be very different from what the tool shows.
The million dollar question everybody would love to know is, what will the rate of return be on my investments?
We defaulted the rate of return to 5%. That is based on historical returns of a diversified portfolio allocated on the conservative side (stock and bonds about equal). You can adjust it however you like and you can even override it for certain assets.
The other million dollar question is what will inflation be? We selected 2% for inflation which also follows conservative estimates.
Got Feedback?
We would be happy to incorporate your feedback into an upcoming release.