Stock Market Returns by Decade
- July 9, 2021
- by Michael
This post summarizes stock and bond returns for each decade from 1930 - present based on three different asset allocations (100% stocks, 50/50 each, and 100% bonds). The returns are often widely different from the average for whole period and reflect what was going on in the world at the time. The data comes from from our Portfolio Allocation Calculator.
Some decades may look good on paper while actually being plagued by inflation. Others looked wonderful but were leading up to huge crashes or periods of uncertainty.
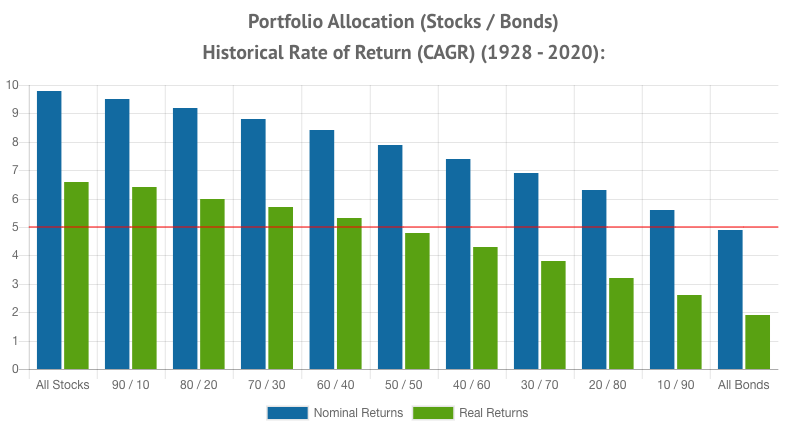
To make investors feel comfortable many financial advisors point to overall market average returns which look fairly rosy. Using our calculator and looking at 1928 to present it shows the following:
- stocks have returned a 9.3% compounded rate of return
- bonds have returned a 4.9% compounded rate of return
- inflation ran at just under 3%.
That sounds pretty good right? Well the problem with this “information” is two fold:
- As human investors we don’t live long enough to enjoy that kind of time horizon
- It is based on historical data. Life is short and nobody really knows where the world is going.
Decade by decade some of the primary events that had a massive economic impact include:
- Great depression
- World War II
- Post-war boom
- Stagflation in the 1970s
- Deregulation of the 1980s
- Dot-com boom
- Dot-com bust
- Great recession
- 2010 and the longest bull market in history in thanks part to the Feds ultra accommodative policies and corporate tax cuts
10-Year Period Surveys
Each graph below has a red line that indicates a baseline 5% return. Blue bars are nominal returns. Green bars are real returns (inflation adjusted).
1930 – 1940
| All Stocks | 50/50 | All Bonds | |
| Compound Annual Growth Rate |
-1.9% |
2.3% |
4.1% |
| Annual Standard Deviation |
30.8% |
15.9% |
3% |
| Inflation |
-2.01% compounded, -16.7% over 10 years. Negative inflation is called deflation, and this is the only decade since 1930 that demonstrates this. |
||
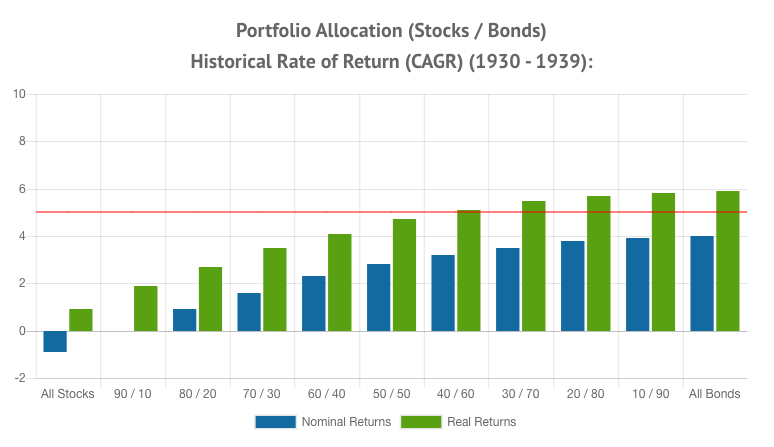
The effects of the Wall Street Crash of 1929 continued throughout the following decade. Banks collapsed due to money runs (this was before FDIC insurance), millions of people lost their life savings and their livelihood. Stocks did terrible. Bonds did pretty well though, especially considering the deflationary environment. This decade was dominated by the economic period known as the Great Depression. Link to calculator for 1930-1939.
1940 – 1949
| All Stocks | 50/50 | All Bonds | |
| Compound Annual Growth Rate |
8.5% |
5.8% |
2.5% |
| Annual Standard Deviation |
15.7% |
8.2% |
2% |
| Inflation |
6.07% compounded, 70% over 10 years |
||
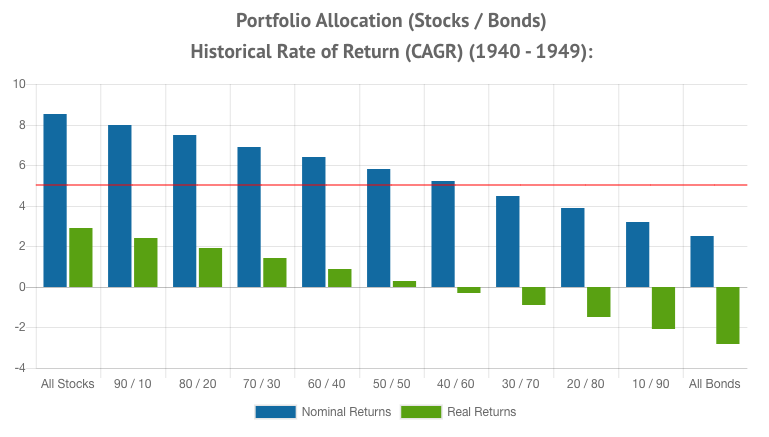
With World War II beginning in 1939, the stock market faced another significant dip at the beginning of this decade but then began to do well as it was clear the US was positioned well. By the end of the 40’s the war was over, the US had won, and things were looking very bright. Bonds did not due to well over this time period, perhaps due the inflation that went along with the war effort. Link to calculator for 1940-1949.
1950 - 1960
| All Stocks | 50/50 | All Bonds | |
| Compound Annual Growth Rate |
19.5% |
10.5% |
0.8% |
| Annual Standard Deviation |
18.7% |
8.9% |
3% |
| Inflation |
2.15% compounded, 21.1% over 10 years |
||
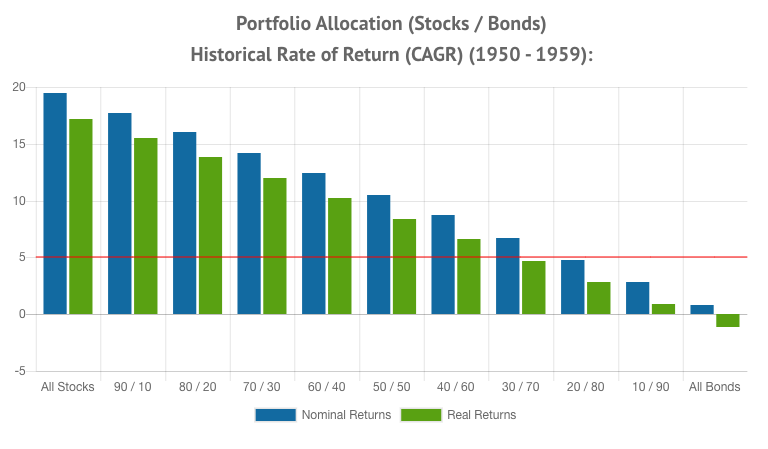
The most prominent development of this decade was the Recession of 1953 that lasted till 1954. Stocks did amazingly well, but bonds lagged significantly. Link to calculator for 1950-1959.
1960 - 1970
| All Stocks | 50/50 | All Bonds | |
| Compound Annual Growth Rate |
7.7% |
5.3% |
2.4% |
| Annual Standard Deviation |
13.5% |
6.8% |
4.2% |
| Inflation |
2.42% compounded, 24% over 10 years |
||
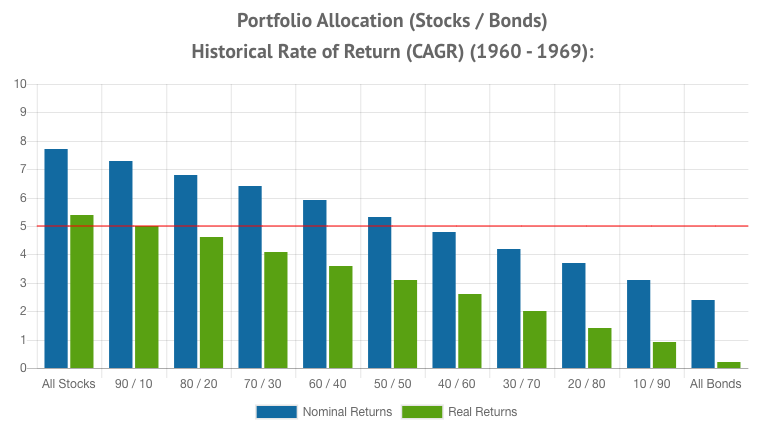
The 1960’s experienced fairly routine returns combined with moderate inflation. Mutual funds began to take off, growing from $17B to $50B by 1969. The decade had its problems with the Vietnam war and the assassination of President John F. Kennedy. The Wall Street back-office crisis was a primary occurrence of this decade. It occurred due to the shortage in personnel, which led to complications in transactions. Link to the calculator for 1960-1969.
1970-1980
| All Stocks | 50/50 | All Bonds | |
| Compound Annual Growth Rate |
5.9% |
6.1% |
5.4% |
| Annual Standard Deviation |
18% |
10.1% |
6% |
| Inflation |
7.2% compounded, 86.9% over 10 years |
||
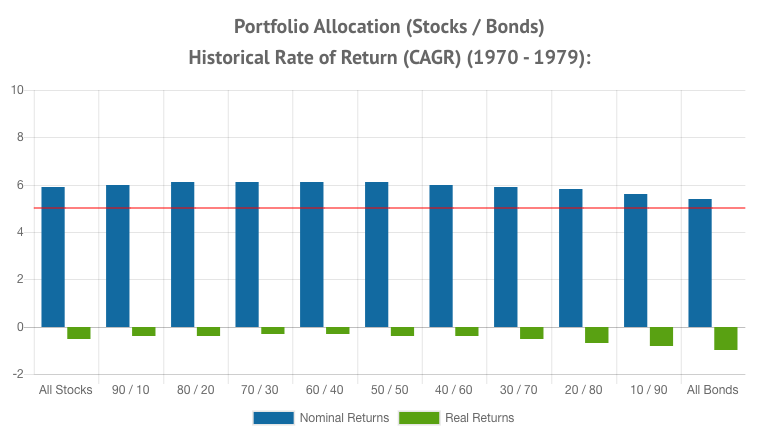
The 1970’s were plagued with high inflation and low growth, known as “stagflation”. Even though the ~6% return for stocks looks good on paper, consider inflation was running at +7% which means the real return for stocks was negative. The calculator includes inflation adjusted returns. The main problem of the 70's was the spike in oil prices which caused a “supply side shock” that led to higher costs for pretty much everything. Link to calculator for 1970-1979.
1980 - 1990
| All Stocks | 50/50 | All Bonds | |
| Compound Annual Growth Rate |
17.3% |
14.9% |
12% |
| Annual Standard Deviation |
11.7% |
9.4% |
11.9% |
| Inflation |
4.64% compounded, 50.4% over 10 years |
||
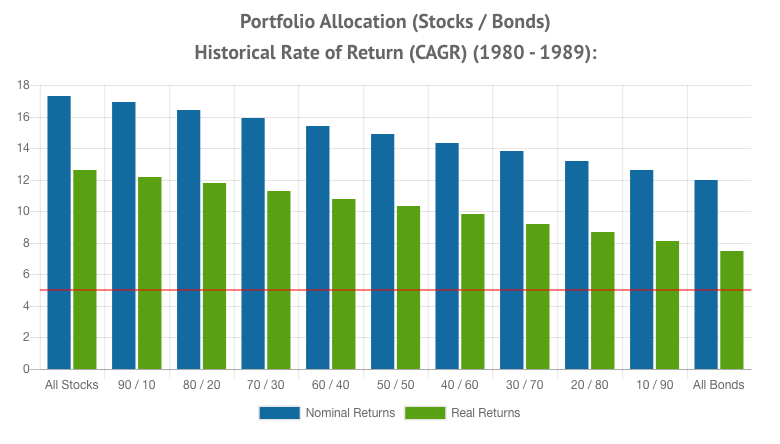
The 1980’s were all about rebuilding America after the stagflation of the 70s. Government deregulation opened the door to corporate mergers and acquisitions which drove stocks higher. Inflation was still higher than the Fed would have liked but it had been tamed. Technology and automation boosted trade processing significantly during this period. As a result, the daily trade volume touched 100 million in 1982. Towards the end of this decade, more than 20% of America’s population (roughly equal to 51 million) owned stocks. Link to calculator for 1980-1989.
1990 - 2000
| All Stocks | 50/50 | All Bonds | |
| Compound Annual Growth Rate |
18% |
12.9% |
7.4% |
| Annual Standard Deviation |
13.3% |
10% |
9.7% |
| Inflation |
2.74% compounded, 27.5% over 10 years |
||
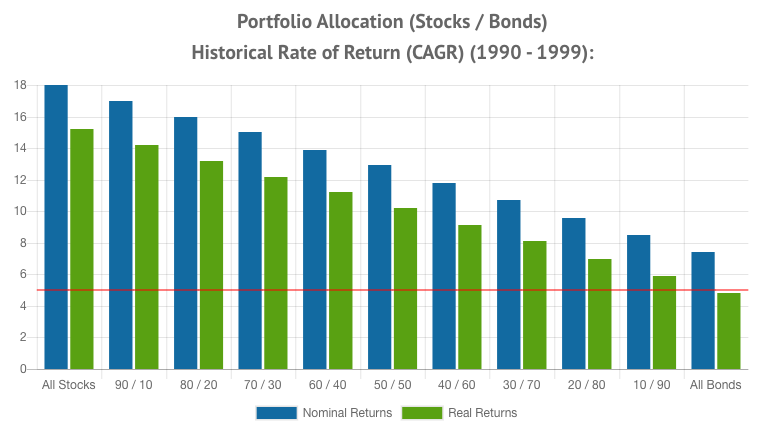
The 1990’s were the go-go days for hot tech stocks. The 90’s stock market was dominated by the “dot com bubble” which sent valuations soaring. The bubble just after this decade ended. The introduction of the Performance Stock Option through The Equity Expansion Act of 1993 brought forth a difference in the accounting treatment of stock options. In 1999, Dow Jones broke 10,000 for the first time. Link to calculator for 1990-1999.
2000 - 2009
| All Stocks | 50/50 | All Bonds | |
| Compound Annual Growth Rate |
-1% |
3.7% |
6.3% |
| Annual Standard Deviation |
19.8% |
6.8% |
8.7% |
| Inflation |
2.47% compounded, 24.6% over 10 years |
||
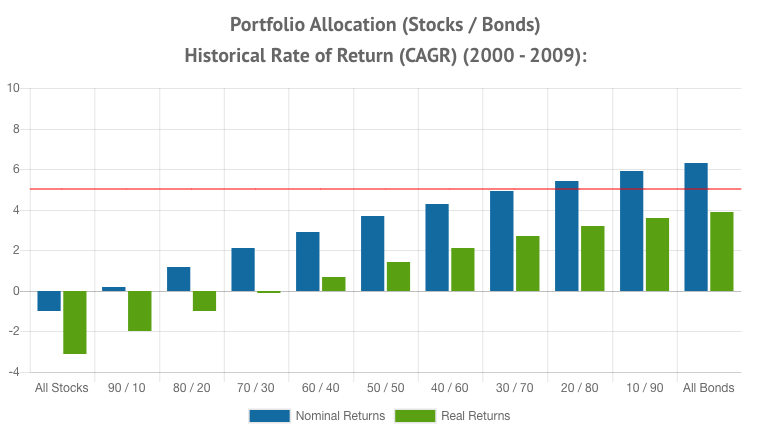
2000-2009 was full of problems holding back the market. The dot com bubble burst in 2000. Then in 2001 the 9/11 terrorist attacks happened. The market bounced back a little and mainly drifted sideways until 2008 when the subprime mortgage crisis hit which kicked off the great recession. Housing and construction markets nearly ground to a halt. This period is known as a “lost decade” for stocks with poor returns and negative real returns. Bonds did well as rates were decent going into the crashes. Link to calculator for 2000-2009.
2010 - 2019
| All Stocks | 50/50 | All Bonds | |
| Compound Annual Growth Rate |
13.4% |
9% |
4.1% |
| Annual Standard Deviation |
11.5% |
6% |
6.7% |
| Inflation |
1.78% compounded, 17.2% over 10 years |
||
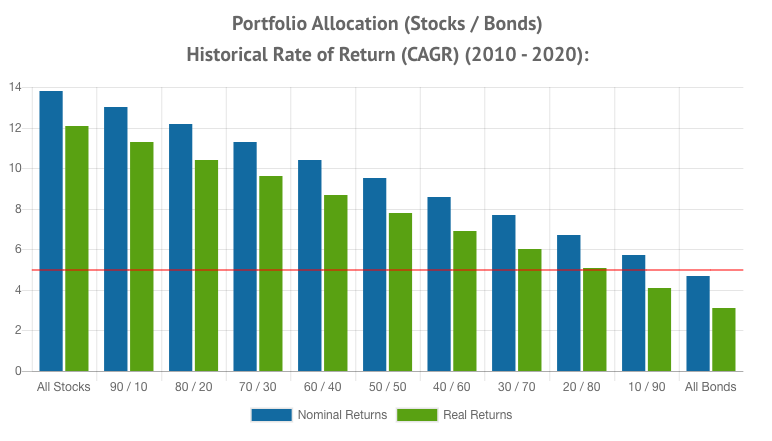
The 2010’s was one of the longest bull markets in history. It was truly a golden age for investors. The bull market run coincided with relatively low inflation. Paradoxically interest rates dropped as the Fed pursued an “accommodative” economic policy. A major corporate tax cut passed through Congress which boosted corporate bottom lines even higher. Link to calculator for 2010-2019.
Final Words
So what comes next? Nobody knows for sure…. Could be rising interest rates, inflation, a stock market crash or correction, a climate change catastrophe, a booming economy due to green technology.... At least we already got a global pandemic out of the way!!!
10 years is a lot of time for a person. In 10 year slices the stock market has demonstrated a wide range of returns. 20 or 30 year horizons are considerably more stable. The moral is investing on a 10 year horizon comes with uncertainty. A 100 year average is far from a guarantee. Even though it looks attractive, no one lives long enough to realize it. Instead we have to live through the short term fluctuations in the market and hope for the best, regardless of our asset allocation. Having more money allocated to less risky assets, such as bonds, can reduce the pain of heavy draw downs, but comes with lower returns.