Asset Allocation Categories - What You Can Bet On
- October 16, 2018
- by Michael

This post explains the investment categories that are commonly found in specialized funds and prospectuses. These asset classes come with complex risk/benefit calculations and can be used to tailor a portfolio to the nth degree.
Asset allocation categories are just different ways of slicing up the market, but they can get very specific. Most people end up owning many of the underlying holdings indirectly through the funds they invest in.
The key when investing in specific categories (be it through individual stocks/bonds, ETFs or mutual funds) is to make sure to understand what you are actually betting on and to do so in a cost effective manner.
Stocks by Market Capitalization / Company Size:
- Large Cap Stocks (aka Blue Chip Stocks)
Large cap stocks are the biggest of the big. They have been around the longest and have the biggest “moat” built around their business so they are less likely to succumb to the competition. Large cap stocks have less room for growth, but they offer more stability and potential for dividends. They are certainly not as safe as bonds or cash, but large cap stocks (particularly US based large cap stocks) are considered the safest among the different categories of stocks. Large cap stocks are companies with a market cap of $10 billion and up.
- Medium Cap Stocks
These are a middle ground between large and small cap stocks. Companies with a market cap between $2 billion and $10 billion are considered medium cap. Medium cap stocks are not as volatile as small cap stocks but still offer more upside that large cap stocks (in theory).
- Small Cap Stocks
Small cap stocks are from companies that have the most potential to grow. Very often small cap stocks do not offer dividends. So small cap stocks are more risky than large cap stocks, but also offer more upside. Small cap stocks are for companies with a market cap of less than $2 billion.
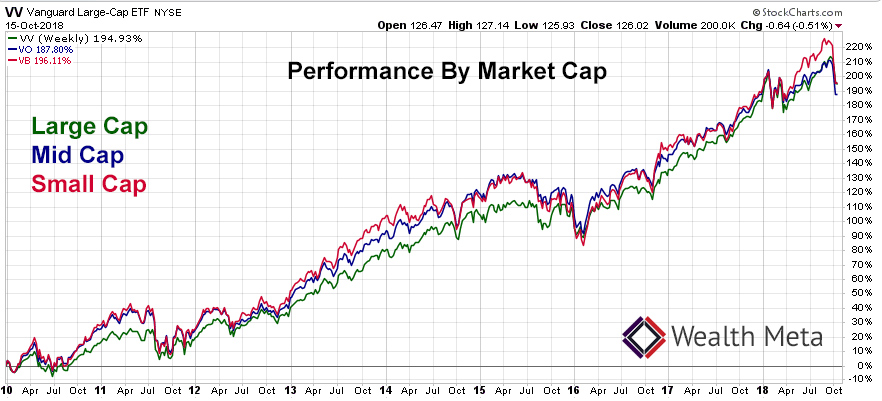
Here is a chart of three Vanguard ETFs from 2010 to 2018: Vanguard Large-Cap ETF (VV), Vanguard Mid-Cap ETF (VO) and Vanguard Small-Cap ETF (VB). Note that small cap and mid cap funds tend to have bigger run ups and steeper crashes (aka more volatility) compared to the large cap fund.
Stocks Funds by Growth vs Value vs Blend:
- Growth Stocks
Growth stocks are from companies where analysts expect stock price appreciation. Growth stocks are riskier than value stocks and typically do not offer dividends.
- Value Stocks
Value stocks, like their name suggests can be had at a bargain and are more likely to pay dividends.
- Blend
A mix of both growth and value stocks - neutral on this front.
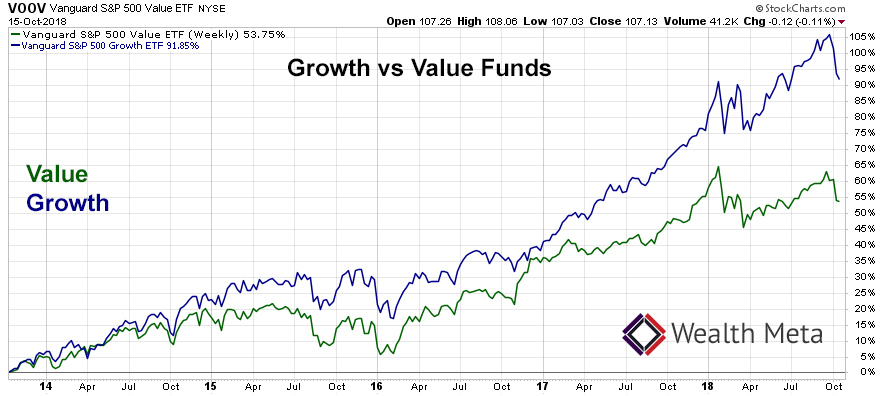
Here is a graph of the Vanguard S&P 500 Value ETF (VOOV) vs Vanguard S&P 500 Growth ETF (VOOG)
Sector Funds:
Sector funds target a section of the economy like energy, technology, health care, etc. Buying into one of these funds is a bet that the particular sector will do better than others. Some sectors are comprised of older more stable companies (like utilities) and others are made up of younger more risky companies (like information technology or biotechnology). Sector funds can be broad or hyper focused depending on the fund. The more specialized the fund typically the higher the expense ratio.
- Technology (software and hardware)
- Financials (banks, brokerages, lenders)
- Consumer Cyclicals (stuff people buy with their extra money, luxury goods, etc)
- Consumer Staples (stuff people buy day to day, food, beverages, etc)
- Utilities (power and gas companies)
- Health Care (hospitals, insurers, medical device makers)
- Precious metals (mining stocks, or bullion)
- Commodities (specific commodity like oil, pork bellies, soybeans, etc)
- Energy (oil companies, gas companies, companies that make equipment for energy industry)
- Transportation (shipping, airlines, trucking)
- Communication Services (cellular phones, internet)
- Real Estate / REITs (real estate investment trusts) - a way to buy into real estate without having to be a landlord. With REITs you are buying into a portfolio of thousands of professionally managed properties. REITs typically pay attractive dividends.
International Stocks:
In general the US is seen as less risky than other countries because it is the largest and most robust economy in the world. However it is still practical to balance US based risk by investing in non-US based companies (aka international stocks). International vs US stocks is done as an additional form of diversification. Almost all “life path” and “all in one” funds own a good percentage of international stocks. There are a number of sub categories:
- Developed Markets - Made up of companies from “developed” countries with large diverse economies such as the United Kingdom, France, Canada, Germany, etc. When it comes to investing outside the US, developed markets are akin to large cap stocks in they are the most stable, but have less upside.
- Emerging Markets - Made up of companies from countries that have high growth potential, but not considered “developed”, for example India, Brazil, China, etc. The risk and reward are going to vary greatly among offerings but in general the emerging market is considered more volatile than the developed market.
- Regional Funds - Made up of companies in a particular part of the world - South America, Europe, Africa, etc.
- Global Stock Funds
These funds include both US and non-US based companies. Since this is a blend of everything the risk is leveled off, but each fund uses its own ratio of US to foreign investment. Built in rebalancing is a nice benefit of this kind of fund.
Bond Categories:
- Treasury Bonds
Treasuries are bonds issued by the United States Treasury. They are virtually risk free as nobody expects the US government to default on its debt. Since the risk is low the rate of return is also low. Treasury bonds are accessible through ETF and mutual funds. You can also purchase them directly from Treasure Direct. Exclusive to Treasury Direct EE bonds and I Bonds offer some unique advantages over bond funds.
- Municipal Bonds
Muni bonds are issued by states, counties and other small government localities that can tax their residents to pay for the interest on the bond. The advantage of muni bonds is you don’t have to pay federal taxes on the interest.
In some cases, you can get a fund that applies to your state so you don’t have to pay state income taxes either.
Muni bonds typically pay a lower rate than regular bonds, but the tax advantages make up for it.
Holding municipal bonds in a tax protected account like an IRA doesn’t make sense because you’re unable to benefit from the special tax exclusion since the IRA already provides that benefit. So it makes sense to hold these in a taxable brokerage account if anywhere.
- International Bonds
These are bonds issued outside the US. Like with stocks they come in broad based funds “total market”, or can focus on just developed or emerging markets.
International bonds work like US bonds but may also include currency risk since they are not denominated in dollars. For example say the bonds are in Japanese Yen, and the Yen collapses. Even if the bond issuers are solid you would still lose. Some funds mitigate the currency risk for you and others don not - so check the prospectus.
- Corporate Bonds
Bonds issued by big corporations, the rate of return is based on the credit rating of the corporation and prevailing interest rates.
- Junk Bonds
Bonds issued by corporations and governments with a poor credit rating. The interest rates on junk bonds is high but so is the risk of default.
Do these categories make investing overly complicated?
For some people, sorting through all the various types funds and ETFs that are out there can be a fun pursuit. But for others all these categories are too much to digest. For the people in the latter category, thankfully, there are plenty of basic approaches to investing. One simple solution touted over and over again at the Boggle Heads forum is the idea of the three fund portfolio. That is a mix of three broad based index funds. The first on US stocks, the second on international stocks, and the third on bonds. The percentage of each can be adjusted based on your risk tolerance.
There are ways to make it even easier on yourself. “Total market” or “broad based” funds cover the categories mentioned above in pre-determined proportions and automatically rebalance so you don’t have to worry about it. When one component does well and another component does poorly the fund managers rebalance keeping the overall allocation in line with the prospectus.
For an individual investor to build a portfolio…
- It would require an excessive amount of research to select the various instruments (individual stocks / bonds, ETFs, funds, etc).
- Transaction costs both in acquiring and rebalancing would eat into returns. This is why brokerage firms offer so many options in the first place!
- The more specific a fund gets the higher the expense ratio, which eats into long term returns. Ever notice on the screen that shows the fund details the expense ratio is typically displayed somewhere hard to locate in a plain font that is easily missed? Meanwhile many other stats are provided in color, designed to pull your eye away.
- An overly complicated portfolio with poorly understood dynamics increases risk without any added benefit. Many assets are correlated in their returns (when A goes down so does B). So in the end, there may be zero benefit to an overly complex asset allocation.
How To Watch Your Asset Allocation
In reality, most people don’t have a perfectly designed three fund portfolio at one brokerage. Money is here, money is there, your current job has different fund choices than your last, etc, etc… That makes it hard to see what your asset allocation really is.