How Asset Allocation Is Related to Net Worth and Risk
- June 14, 2019
- by Emily

Do you know what your net worth is, where it is allocated, and how much risk you are carrying? This post shows how three families with very different asset allocations fare over a five year period.
Asset allocation describes how your assets are distributed across different types of investments like stocks, bonds and real estate. Your asset allocation affects the growth (or lack thereof) of your net worth. The more risk the more potential reward but also the more potential down side. Knowing your allocation is an important part of taking control of your investments - and making sure that you are using your assets in a way that is in line with your investment priorities and risk tolerance.
Let’s consider three scenarios:
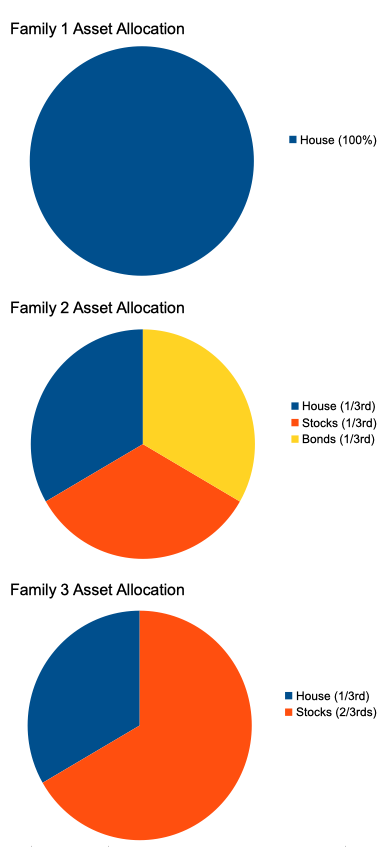
- Family 1 has a fully paid-off home worth $300,000, but doesn’t have any stocks or bonds.
- Family 2 has a paid-off home worth $100,000. This family also has $100,000 in stocks and $100,000 in bonds.
- Family 3 has a paid-off home worth $100,000. This family has $200,000 invested in stocks.
These families all have the exact same net worth: $300,000. But they have very different asset allocations.
- Family 1 - 100% real estate in the town they live in.
- Family 2 - 33.3% real estate in the town the live in, 33.3% stocks, 33.3% bonds.
- Family 3 - 33.3% real estate in the town they live in, 66.6% in stocks.
So which family is the safest?
One way to look at risk is diversification (how spread out your assets are).
Family 1 is only at risk if their local real estate market collapses, or their home gets sucked into a sinkhole and they don’t have insurance. But if the stock market crashes due to a computer glitch, they probably won’t be impacted much.
Family 2 is the most diversified with their assets spread across three classes (real estate, stocks, bonds). This isn’t to say you should have your money divided equally among every asset category. Family 2 just happens to be setup that way in this example.
Family 3 has risk in real estate, and double that amount in stocks, but no bonds. Generally speaking, bonds are considered safer than stocks because their value is based mainly on interest rates not speculation. The down side of bonds is limited, but so is the upside. In a crash most people sell stocks and buy the 'safety' of bonds. Family 3 isn’t worried about the price of stocks dropping suddenly. They are willing to put a higher percentage of their net worth into stocks, accepting that they may lose money, in exchange for a possible higher return.
Realistically a lot of older people with equity in their home probably don’t realize just how much of their net worth floats on the local real estate market. In fact many argue that home equity shouldn’t be included in net worth because you can’t “eat it”, that is sell a small part of it and buy groceries. We’ve thought about this subject a lot and broke down total net worth vs investable net worth, and also wrote a tool that helps you track your net worth and analyze your overall asset allocation.
What about asset appreciation? Which family will do the best in 5 years, all else held fixed?
Given the three families above have different asset allocations their net worth will change at different rates for different reasons. Let’s see what happens to each of these families net worth in five years, assuming they don’t save or invest any more money, but just coast on the same investments allocated in the same way, and not bothering to rebalance.
Different asset classes are expected to grow at different rates based on historical measures. These historical measures always come with a disclaimer that “past returns do not guarantee future performance”.
The exact numbers for the returns on stocks and bonds vary considerably depending on the years you’re looking at, but for the purpose of this article I'm using the figures found here, and assuming an average return of 11.5% for stocks and 5.2% for bonds. As for real estate prices, those are even more complicated and volatile - so we’ll assume a 3.7% annual increase in home value.
Note that these are rosy, nominal values based on the arithmetic average (add up the returns and divide by the number of years). A better way to do it is to adjusted for inflation and use the compounded average instead (determine the annual compound rate needed to arrive at the resulting return). Again this is a basic example so the actual numbers don’t matter.
So, what would each family’s net worth be 5 years down the road?
Family 1 would have a net worth of $359,762, all tied up in home equity.
|
House at 3.7% |
|
|---|---|
|
Year |
$300,000 |
|
1 |
$311,100 |
|
2 |
$322,611 |
|
3 |
$334,547 |
|
4 |
$346,926 |
|
5 |
$359,762 |
|
TOTAL: |
$359,761.79 |
Family 2 would have $119,921 in home equity, $172,335 in stocks and $128,848 in bonds, for a total net worth of $421,104.
|
House at 3.7% |
Stocks at 11.5% |
Bonds at 5.2% |
|
|---|---|---|---|
|
Year |
$100,000 |
$100,000 |
$100,000 |
|
1 |
$103,700 |
$111,500 |
$105,200 |
|
2 |
$107,537 |
$124,323 |
$110,670 |
|
3 |
$111,516 |
$138,620 |
$116,425 |
|
4 |
$115,642 |
$154,561 |
$122,479 |
|
5 |
$119,921 |
$172,335 |
$128,848 |
|
TOTAL: |
$421,104.24 |
||
Family 3 would have $119,921 in home equity, plus $344,671 in stocks, for a total net worth of $464,591.
|
House at 3.7% |
Stocks at 11.5% |
|
|---|---|---|
|
Year |
$100,000 |
$200,000 |
|
1 |
$103,700 |
$223,000 |
|
2 |
$107,537 |
$248,645 |
|
3 |
$111,516 |
$277,239 |
|
4 |
$115,642 |
$309,122 |
|
5 |
$119,921 |
$344,671 |
|
TOTAL: |
$464,591.27 |
Even in the relatively short time frame of five years, the family with more stocks has a considerably higher net worth than either the family with a 50/50 stock and bond split or the family with all of their net worth in their home.
This results in the following ending asset allocations:
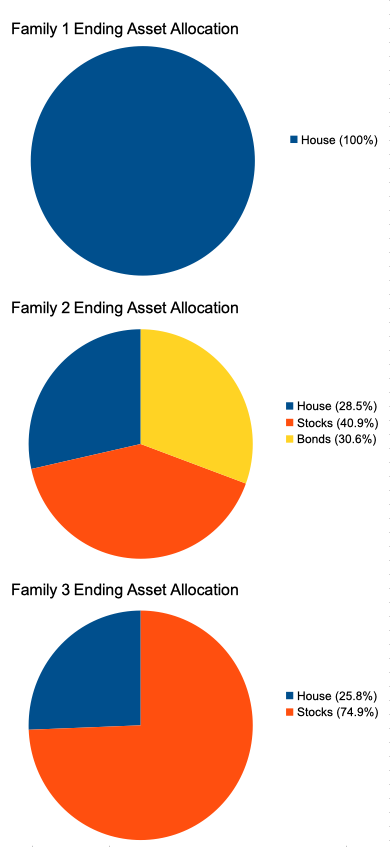
Due to the run up in stocks for Family 2 and Family 3, they are now much more heavily weighted in stocks, which means they are in a riskier position 5 years later vs when they started. Rebalancing back to target allocations every 6-12 months is the way to control that. It is a kind of automatic “buy low and sell high” mechanism.
This scenario assumed that everything went well for all three asset categories over the five-year period. In terms of financial live, five years is nothing.
Self proclaimed called financial experts who say "keep your money out of your house" are being fooled by short term trends like this. What they are actually saying is "keep your money out of your house and gamble it on stocks"... Many times they are right but not always. The times they are wrong, what do they care, you already bought their book or training course and they are long gone. If you explore the asset returns in our stocks vs bonds calculator you can see that some decades produce little to no returns while others do amazing.
Choosing how to allocate assets isn’t just about maximizing your returns, it’s also about knowing your risk tolerance. People who are more risk-averse might feel more comfortable with a higher percentage of their assets invested in bonds or even CDs—and that’s ok, as long as they are making those decisions consciously.
Want to get a better look into your net worth? Use Wealth Meta’s Net Worth Dashboard to easily visualize how your assets are distributed… and see if anything needs changing.
Want to run some quick simulations when saving for retirement or drawing down your nest egg? Check out our saving for retirement calculator, and the will you outlive your money calculator which both allow you to adjust the asset allocation across stocks, bonds and cash.